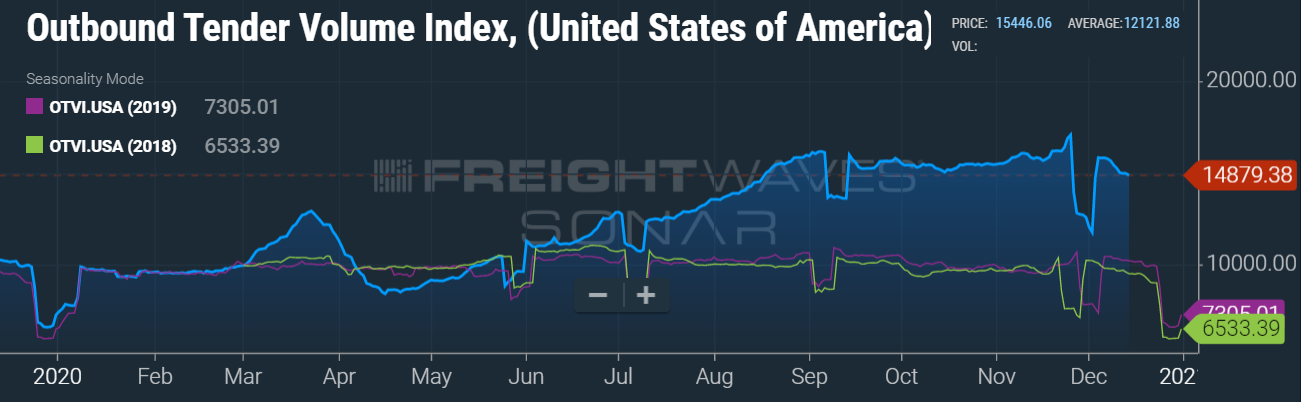
With truckloads declining slightly, why the nationwide increase in rates?
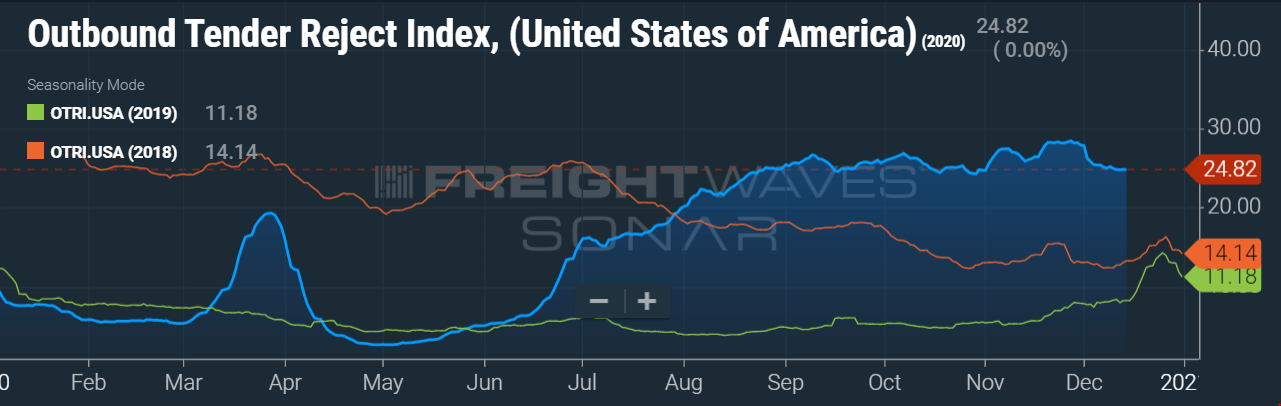
Truckload volumes currently sit at the lowest they’ve been since August 17 (not including the temporary, post-holiday dips), shown in blue in the chart above. However, using the word “lowest” is a bit misleading considering that there is 50% more freight on the road when compared to this time last year. Tender rejections have also decreased to slightly below 25%, coming in at 24.82%, well above where we were in 2019 which was only at 8.19%. The chart below shows 2019 in green, but the number on the right of the chart indicates what the rejection rate was on 12/31/2019. The charts are expanded to show historical data from 2019 and 2018 to help predict what to expect in the upcoming weeks.
 Last week we discussed how the long hauls (1,000+mi) were 27% of all truckloads, which takes that equipment “out of circulation” for at least a few days while en route to its destination. Once the truck arrives, it is typically far from where the concentration of outbound loads are located and where capacity is needed the most. This feeds into the volatile supply and demand issue which will further increase pricing. Freight typically moving via rail is now being shipped via truckload because the products need to get to their destination in a more timely manner with the Holidays rapidly approaching. Therefore, some shippers are choosing to ship via truckload to get it to the destination ASAP, adding to the spot-market freight, and strain on capacity.
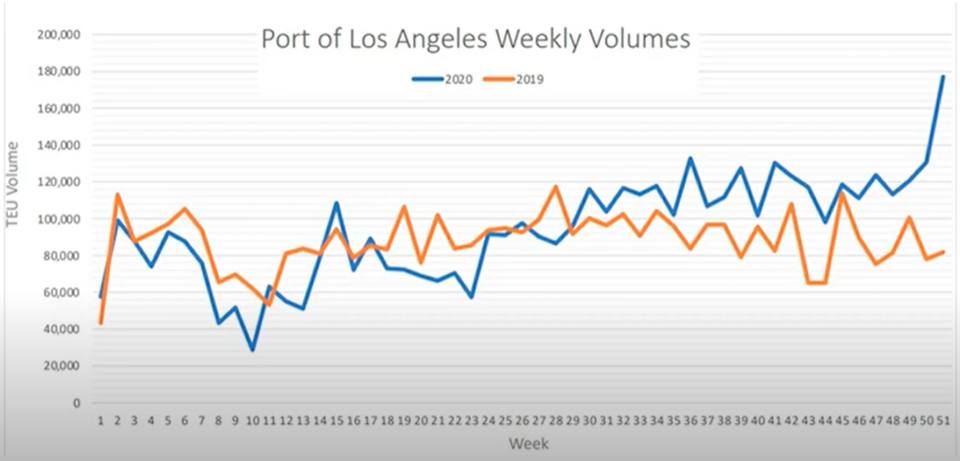
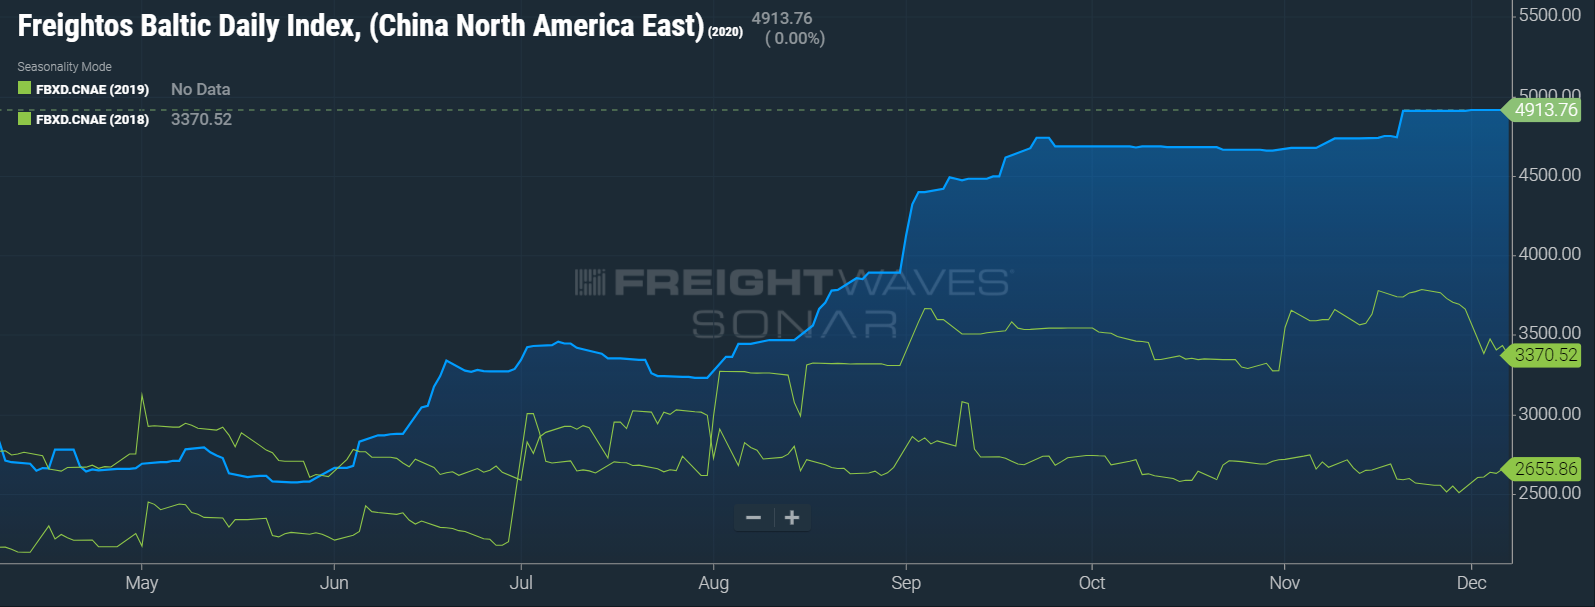
In previous weeks, we showed charts that indicated a high volume of goods making their way to the US from overseas. While these volumes are no longer increasing, these inbound shipments remain at an extremely high level. If we focus on just the Port of LA, you will see the abundance of shipments that have arrived over the past couple of weeks, with 27% more than last week and 48% more year-over-year. This is still a whopping 25% higher than the tariff pull-forward in 2018. The projection for next week into the Port of LA is not much less either. Inventories are being restocked from the holiday surge and the overall shift in consumer spending is still very apparent. This is directly feeding into those long haul shipments we just discussed, and also why rates went up another few cents per mile last week. This is also why there is continued, upward pressure on spot market rates. We left the charts below from last week to reiterate that the market will not return to normal in a few weeks in 2021. Though it will loosen slightly after the holidays, the overall extra volume and consumer spending habits should remain fairly consistent throughout Q1 because this shows what will arrive in the US in about 10 days.
At MegaCorp we continue to pledge to provide reliable service to our clients. You can trust that we will deliver.

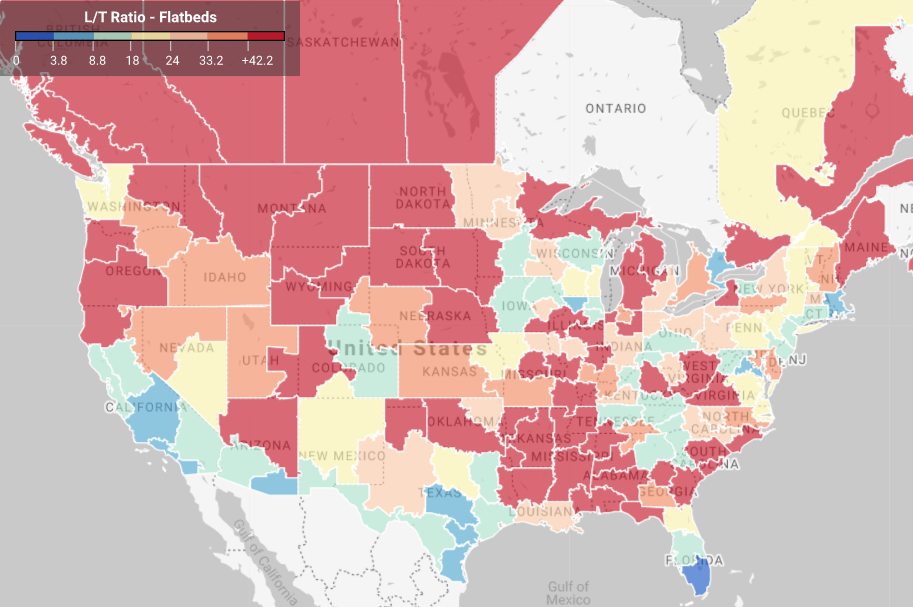
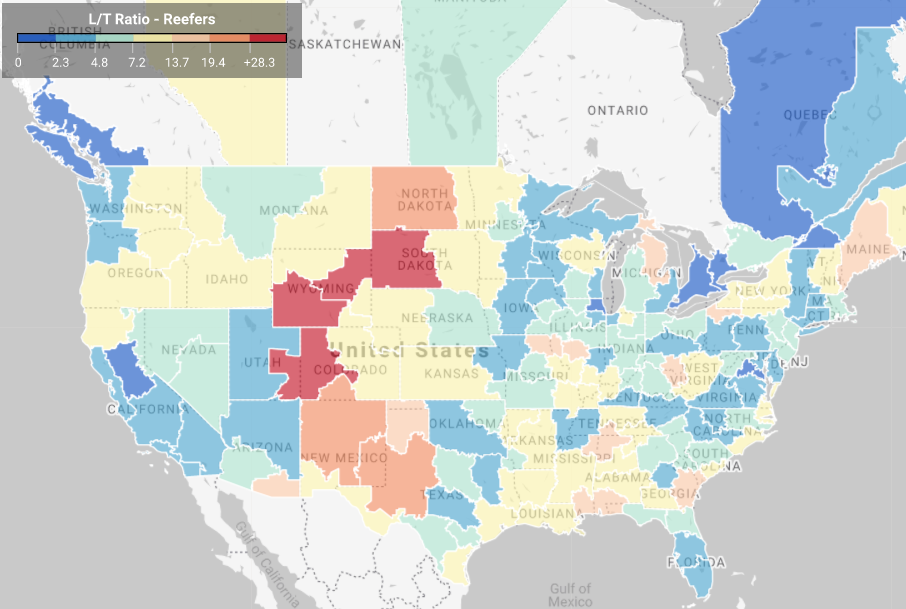
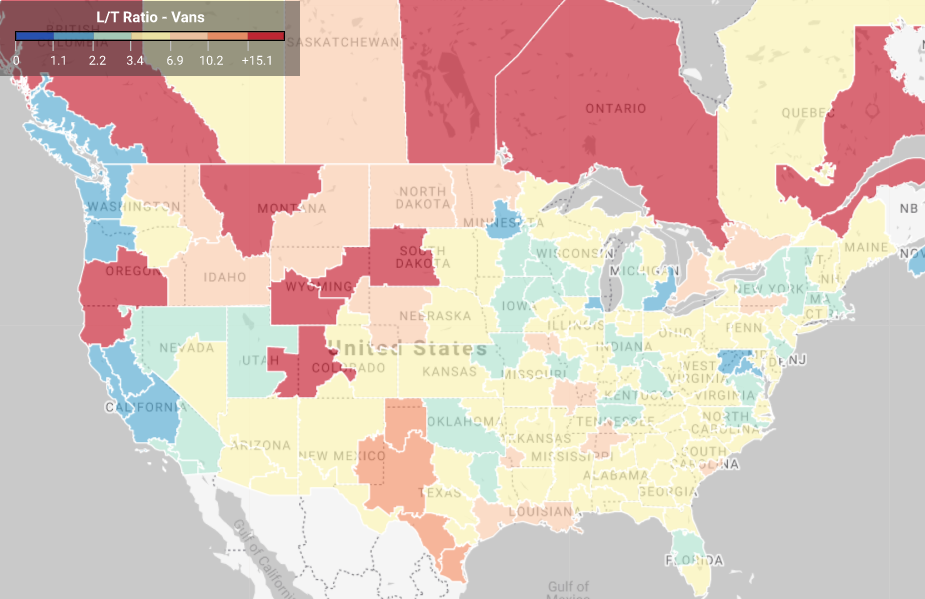
Load to truck ratio from the prior 7-day average
About MegaCorp
MegaCorp Logistics, founded by Denise and Ryan Legg in 2009, specializes in full truckload shipments (dry van, refrigerated, flatbed, intermodal, etc.) and less-than-truckload shipments throughout the US, Canada, and Mexico. MegaCorp is committed to creating long-term, strategic partnerships with our clients who range from Fortune 100 companies to regional manufacturers and distributors. We serve all business sectors of the US economy including (but not limited to) food, retail, government, textiles, and metals/building materials. We strive to offer the best to our clients, transportation partners, and employees– It’s the Mega Way!
For a shipping quote, please CLICK HERE.