No Signs of Slowing Down or Loosening
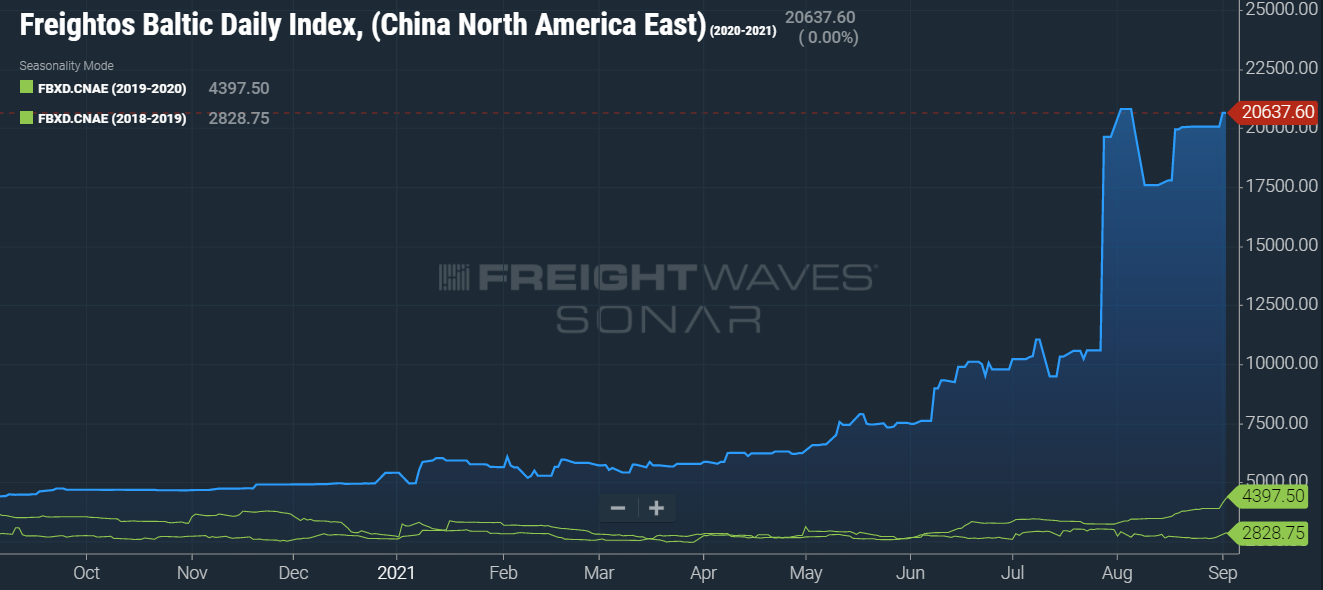
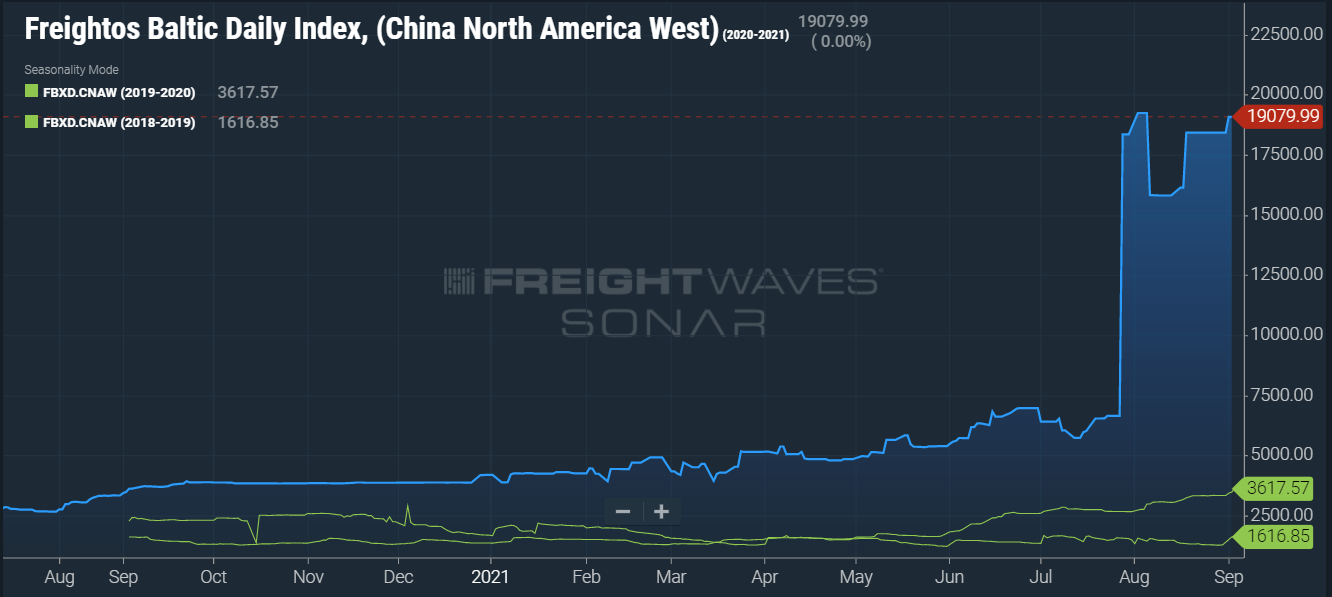
The annual rush to get inventory onto the shelves for the busiest season of the year is underway. Shippers are ordering more, and ordering earlier, with hopes of not running into shortages and delays during the holiday season, which is what happened in 2020. This mass buying surge has vessel congestion in the ports at an all-time high, again. This is a source of significant concern across the supply chain, as these products and parts will become full-truckloads at some point in their life cycle.
There are 44 ships waiting off of the CA coast to dock because the ports are full. The abundance of shipments is depicted in the charts to the right that indicates what is on its way to the US coasts from China. For reference, before the Pandemic, the normal number of container ships at anchor was one for most ports on any given day. This is the worst bottleneck situation in history, all stemming from the Pandemic in one way or another, from labor shortages and COVID-19 related disruptions to earlier mass buying for the holiday season due to the uncertainty as to exactly when the products will arrive on US soil. Another reason we are seeing an extreme surge right now is that “Golden Week”, a week-long holiday celebrated by China and Hong Kong, occurs the first week in October so a lot of shipments are scheduled to ship out ahead of the holiday.
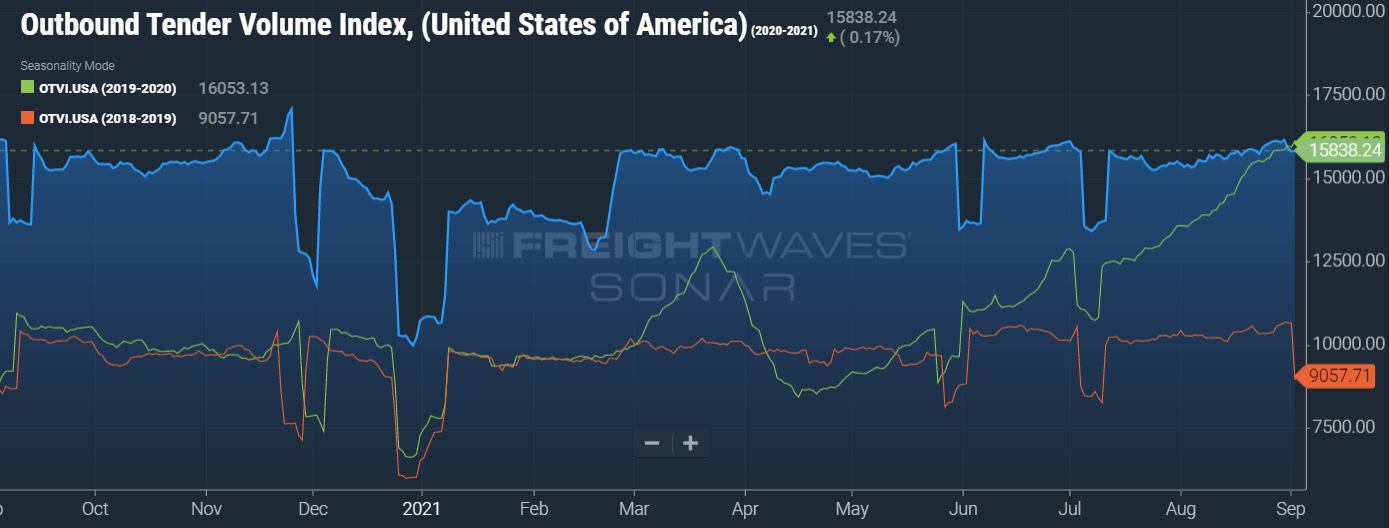
It is no surprise that the Outbound Tender Volume for truckloads continues to stay elevated at the “new-normal” of above 50% more loads than pre-Pandemic times. The industry just surpassed 12 months of record-breaking volumes and we expect no different by the end of September as we gear up for the holiday season. August ended with a daily volume index of 16,156 and the previous record, pre-Pandemic, was 10,574. From the chart above it is pretty apparent this level of volume is here to stay through Q4 at least. It will take some time into 2022 for the volumes to level off to near pre-Pandemic times. This capacity crunch won’t last forever (even though it feels like it will especially with the longevity of this freight volume surge).
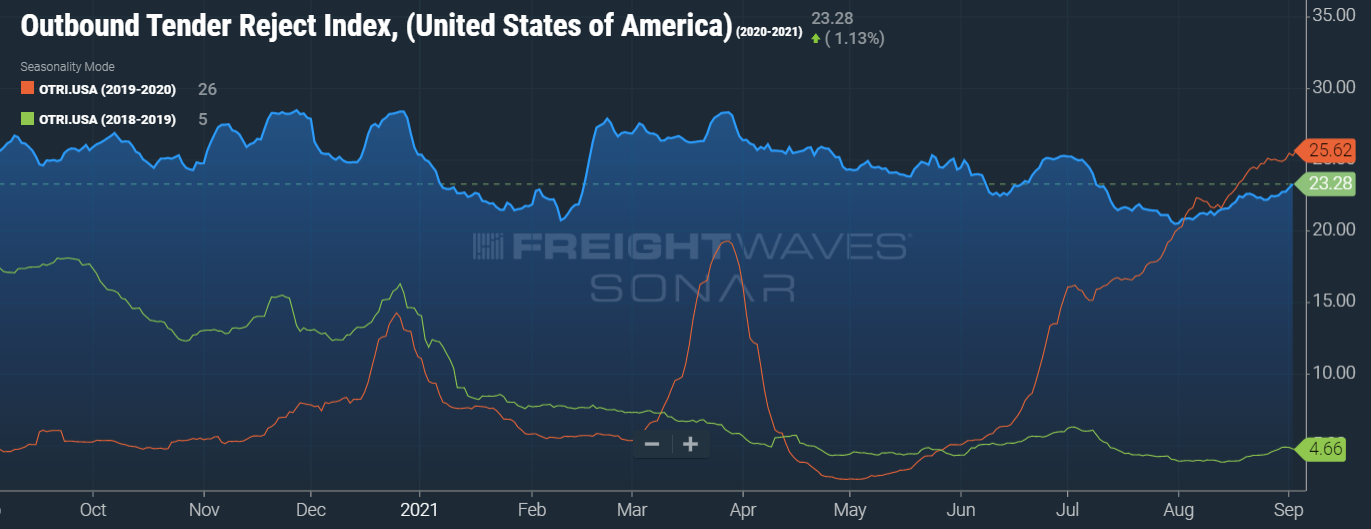
On a positive note, the Outbound Tender Rejection Index is slightly less than it was this time last year. Unfortunately, it is currently coming in at 23.28% and climbing. For perspective, a tender rejection rate for early September during a “normal” year would be around 5%, except for when hurricanes disrupt the supply chain where it would temporarily spike to 10-15%.
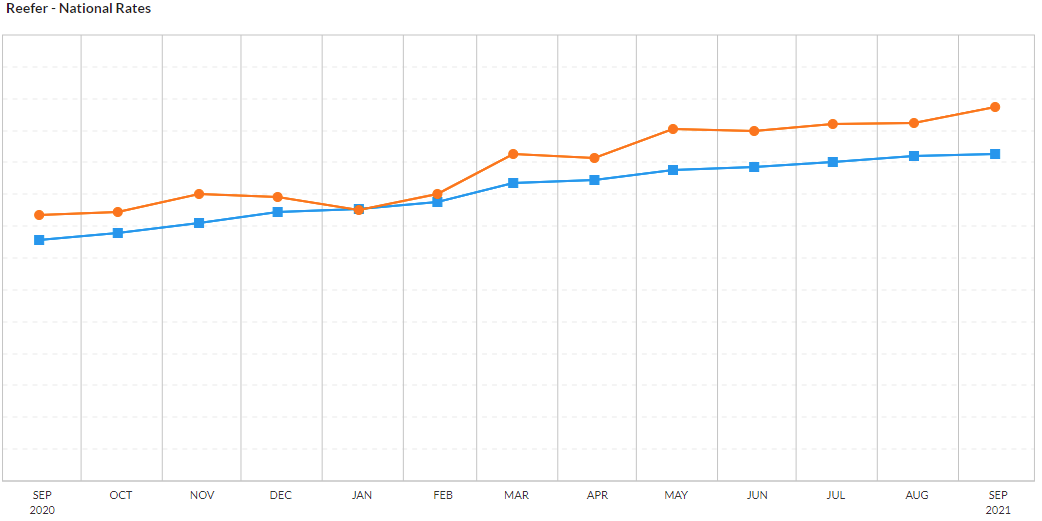
Hurricane Ida is one reason the rejection rate started climbing again, along with rate increase. This is due to displaced capacity and delays as trucks face outages, road closures and fuel supply challenges in Ida’s wake. This feeds into even further increased spot rates, especially for temperature-controlled loads, as shown in orange within the chart to the right. The steady climb in spot rates will continue to pressure contract rates to increase to be able to compete for capacity. These factors will keep capacity at historically tight levels and will cause record-breaking freight costs. As always, MegaCorp is here to help. You can rely on us in any market and trust that we will deliver.
Load to truck ratio from the prior 7-day average.
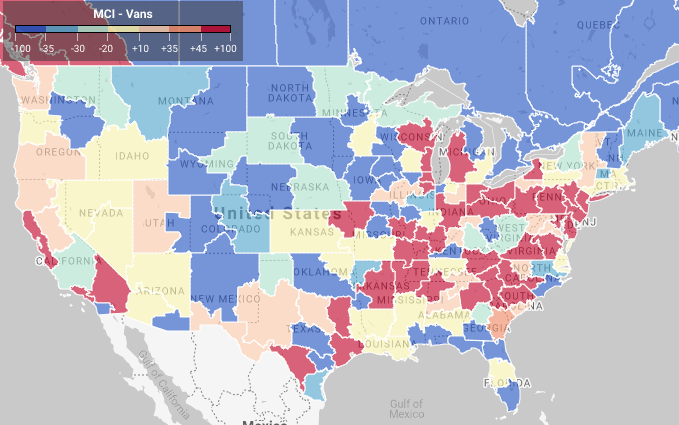
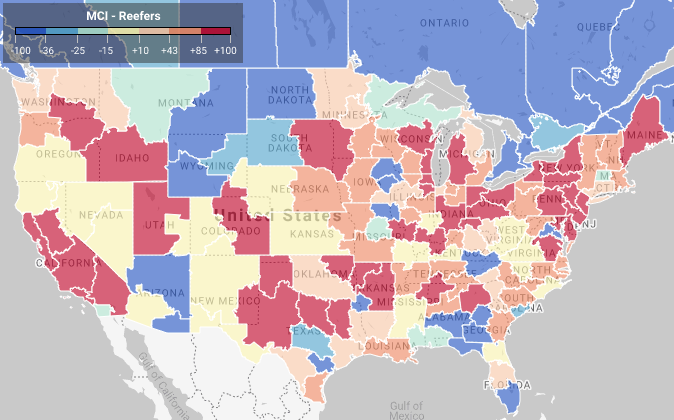
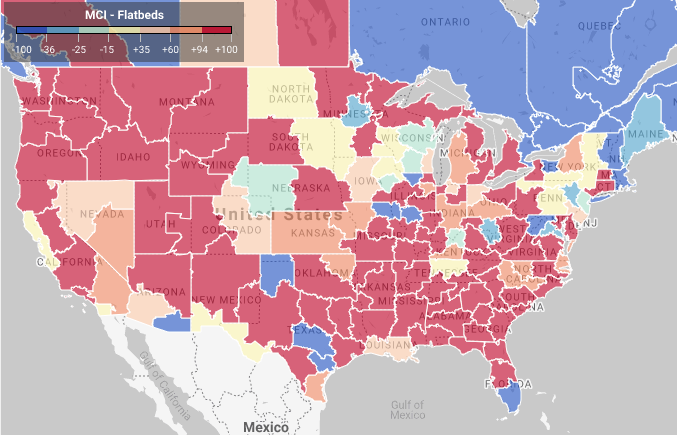
The charts below are load to shipment ratios. For example, red indicates one truck for every 45+ shipments.
MegaCorp Logistics, founded by Denise and Ryan Legg in 2009, specializes in full truckload shipments (dry van, refrigerated, flatbed, etc), less-than-truckload, and intermodal shipments throughout the US, Canada, and Mexico. MegaCorp is committed to creating long-term, strategic partnerships with our clients who range from Fortune 100 companies to regional manufacturers and distributors. We serve all business sectors of the US economy including (but not limited to) food, retail, government, textiles, and metals/building materials. We strive to offer the best to our clients, transportation partners, and employees– It’s the Mega Way! You can trust that we will deliver.
For a shipping quote, please CLICK HERE.
